Space heating accounted for over half of energy consumption in the residential sector in IEA countries in 2014 (Photograph: Shutterstock)
Having reliable data and indicators on how energy is used is key to informing and monitoring the effectiveness of energy efficiency policies. Highlighting the importance of such data, the IEA has for the first time published an Energy Efficiency Indicators database with annual data from 2000 to 2015.
The database covers end use energy consumption for 8 energy products and includes end use energy efficiency indicators and carbon intensity indicators for 4 sectors (residential, services, industry and transport) for IEA member countries. These indicators are computed by using key sectorial activity data.
This comprehensive and disaggregated database provides valuable insights on the patterns of energy consumption at country level, and enables countries to keep track of efficiency improvements across sectors and end uses.
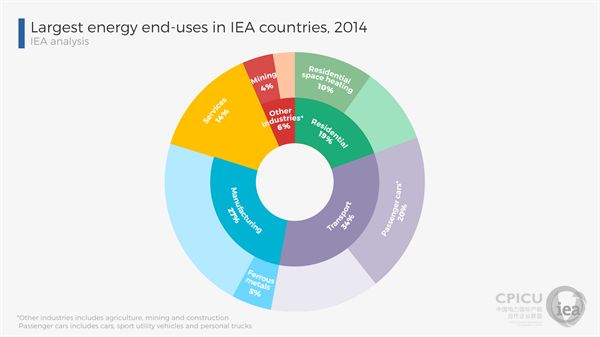
The key sectors for tracking energy efficiency progress are transport, services, manufacturing and the residential sector. Across IEA countries, the transport sector accounted for the highest share of final energy consumption in 2014 (34%), followed by manufacturing industry (27%), the residential sector (19%) and finally the services sector (14%).

The indicators used to measure energy efficiency across these sectors are chosen to best represent energy efficiency in that context. For example in transportation, passenger transport intensity indicates the amount of energy used to move one passenger over a distance of one kilometre. Intensity levels vary across countries depending on the share of modes (e.g. road, air, water, rail), vehicle types in the mix (e.g. passenger cars, buses, etc.) and on the average occupancy (passengers per vehicle) – which in many countries has decreased over time as people increasingly drive their vehicles alone.
Passenger transport intensity is particularly high in countries like the United States, due to the large use of passenger cars (of which a high share are SUVs) and domestic flights as compared to more efficient transportation modes like buses and trains. Conversely, this indicator is comparatively low in countries like France, where rail transport is relatively common.
Looking at residential buildings, energy efficiency improvements for space heating are tracked by trends in residential space heating intensity – defined as energy consumption per floor area. This indicator significantly decreased in many IEA countries, for instance, Austria, France, Germany, Ireland, Korea, Netherlands and Spain have experienced reductions of more than 30% since 2000. Warmer countries generally have lower space heating intensities, as less energy is needed on average to keep the temperature inside residential buildings at a comfort level.
For manufacturing, the average manufacturing energy intensity in a country depends on the relative weight of the different sub-sectors in the manufacturing mix. For example, the intensity is particularly high in countries like Finland, where the paper, pulp and printing industry – which is very energy-intensive – represented over half of total manufacturing energy consumption in 2014.
Overall, the manufacturing sector intensity has decreased over time across virtually all countries. For example, in the United States it decreased about 38% in the period 2000-2014, due to efficiency improvements mainly in the chemicals and basic metals sub-sectors, but also because of increasing shares of low energy-intensive sub-sectors, like machinery.

